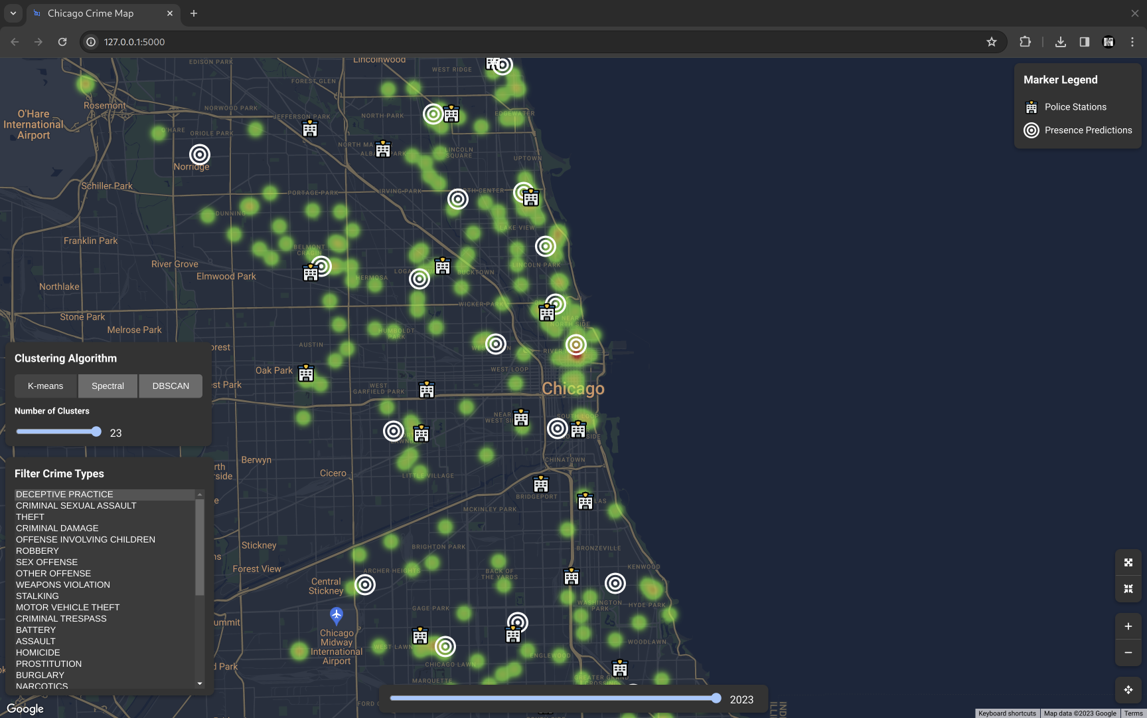
User Interface

Task
As part of the “Data Mining” course at the University of Oklahoma, this project analyzed crime incidents in Chicago to identify spatial patterns and recommend improved police station placements using unsupervised learning.
Dataset
We used the publicly available Chicago Crime Dataset from the Chicago Data Portal, containing geotagged crime reports from 2001 onwards. Each entry includes crime type, timestamp, and location (latitude/longitude). For this project, we focused on incidents from 2021–2023 and selected relevant crime categories (e.g., theft, assault, arson).
Clustering Algorithms
We implemented three clustering algorithms to group crime hotspots:
- K-Means: With
k defaulted to the number of existing police stations.
- Spectral Clustering: Used for handling non-convex data distributions via eigenvector transformation.
- DBSCAN: Density-based, requiring no prior specification of cluster count and able to detect outliers.
Each method was benchmarked for performance and interpretability across different spatial crime distributions.
Application
The backend, built with Flask (Python), handles data ingestion, clustering logic, and API endpoints. The frontend uses vanilla JS with Google Maps integration to display:
- Dynamic heatmaps and marker clusters
- Crime type filters
- Time-based filtering and playback (2021–2023)
- Interactive selection of clustering method and parameters
Users can visually compare algorithm results and observe how cluster centers align or diverge from current police station locations.


